TableOCR
What is TableOCR?
I wrote this program to collect candidate lists for local elections. Unfortunately, this data came in different formats, which made it practically impossible to train layout recognition models. Thus, I decided to write my own program. What exactly is TableOCR? TableOCR is a ShinyApp that combines the manually created layout information of a page with the automatic extraction of text from that layout using OCR engines like Google Vision API or Tesseract. It is basically a tool for a semi-automated workflow that can be useful if a) the data layout is messy, b) the data layout varies significantly from document to document, or c) there are only a limited number of documents to digitize.
How to install TableOCR?
You can install TableOCR in R using the devtools package and the link to my github repository.
# install devtools library
install.packages("devtools")

# load library
library(devtools)

# install tableOCR
install_github("tichelbaecker/tableOCR")
How to use TableOCR?
You start TableOCR by loading the tableOCR package and calling the table_ocr function.
# load library
library("tableOCR")

# run table_ocr function
table_ocr()
Note that you have to provide a Google API json credential file if you want to use TableOCR. You can find an instruction for retrieving a json file for Google’s Vision API here. If you have a Google json file downloaded, set the environment variable either in the system environment or in the local environment (see the documentation of the googleCloudVisionR package for details). You can then call the table_ocr function.
# load library
library("tableOCR")

# set environment variable
Sys.setenv("GCV_AUTH_FILE" = "/path_to_your/json_file.json")

# load googleCloudVisionR package
library(googleCloudVisionR)

# start tableOCR
table_ocr(auth_file_path = "/path_to_your/json_file.json")
How does TableOCR work?
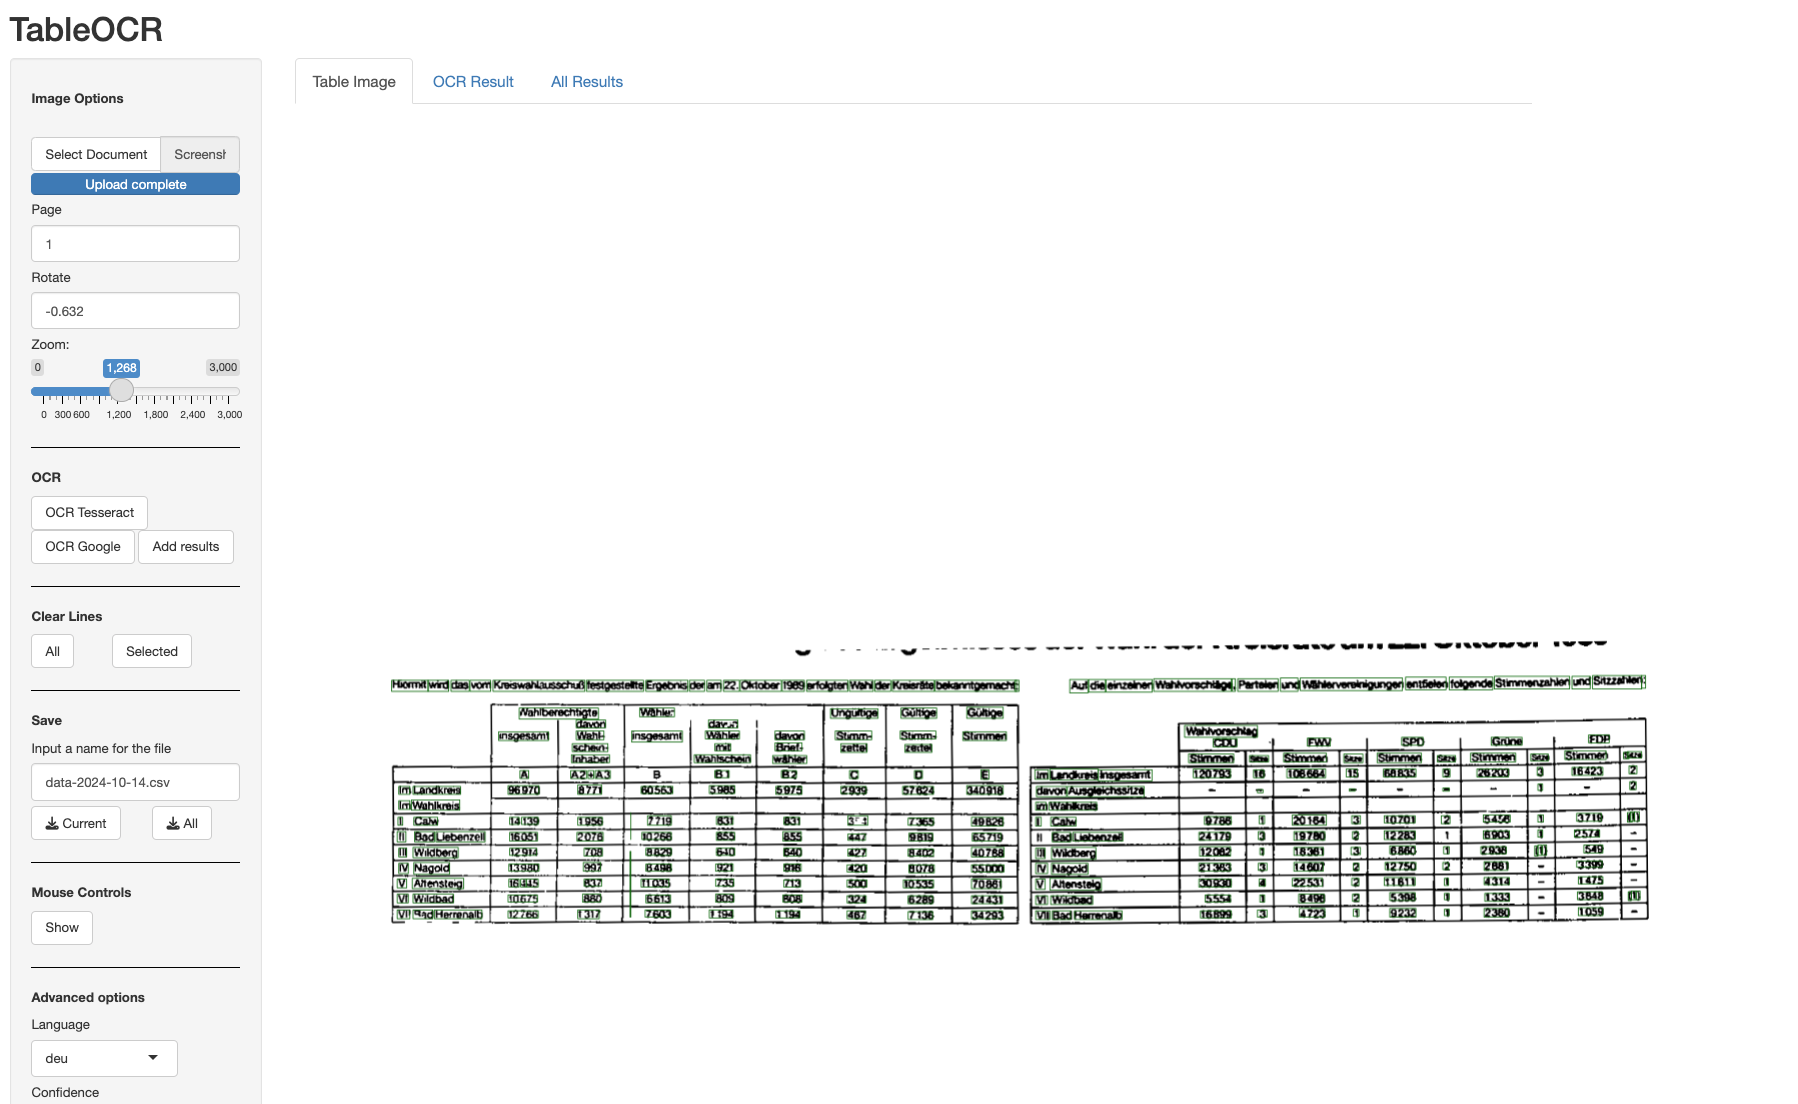
When calling the table_ocr function, the ShinyApp opens in a window. Here, you can simply use the Select Document button. Once you selected a pdf or imagefile, it should open up and become visible in the ShinyApp window. You can set column dividers (vertical line) by simple left mouseclicks in the picture. You can also add a top and bottom ruler for a given table. For that, hold a on your keyboard while clicking on the desired position. This will add a vertical line. Now, you can read perform OCR on the manually set layout. You see the results in the OCR Results tab.
Buttons and fields
| Basic page processing | |
Select Document |
Click to select document. Make sure that file suffix is not capitalized (.pdf not .PDF). |
Page |
Allows you select a page for a multipage PDF document. |
Rotate |
Takes positive and negative values and rotates by the respective degrees |
Zoom |
Higher values let you zoom into the picture. |
| OCR | |
OCR Tesseract |
Uses tesseract as OCR engine (still not fully implemented) |
OCR Google |
Uses Google Vision API engine (requires json auth file see above) |
Add results |
Useful if OCRed data is part of larger table. Allows to OCR table and add to table in All Results tab. |
| Delete lines | |
All |
Deletes all lines in an image |
Selected |
Deletes all selected lines in an image |
| Save | |
Current |
Saves table in OCR Results
|
All |
Saves table in All Results
|
Example
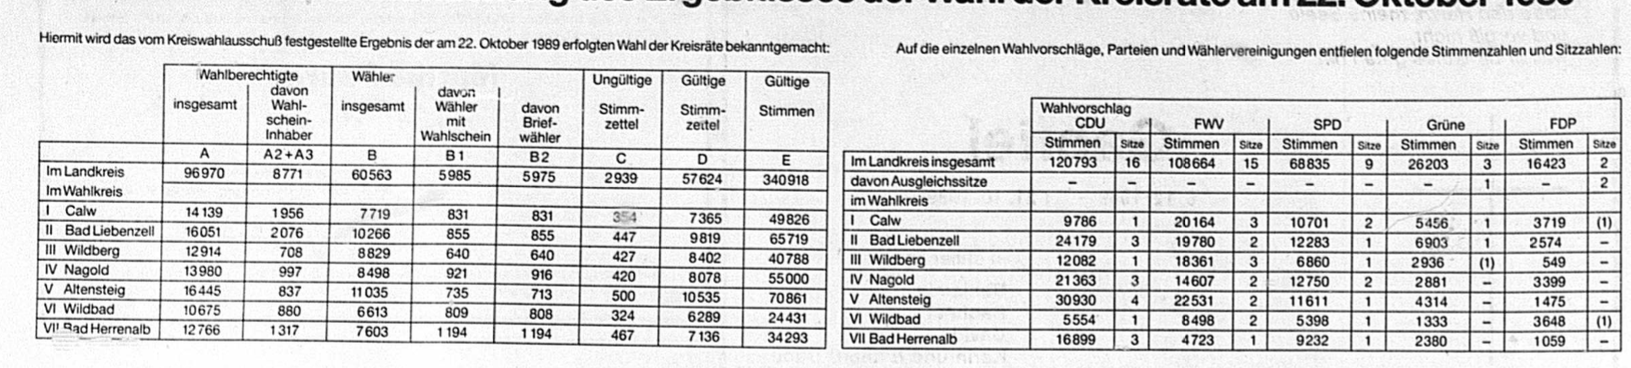
To give an illustrative example, let’s consider this table from the results of county elections in the county of Calw in the state of Baden-Wuerttemberg in 1989. The table provides results by electoral district. For demonstrative purposes, we only want to extract the left table.
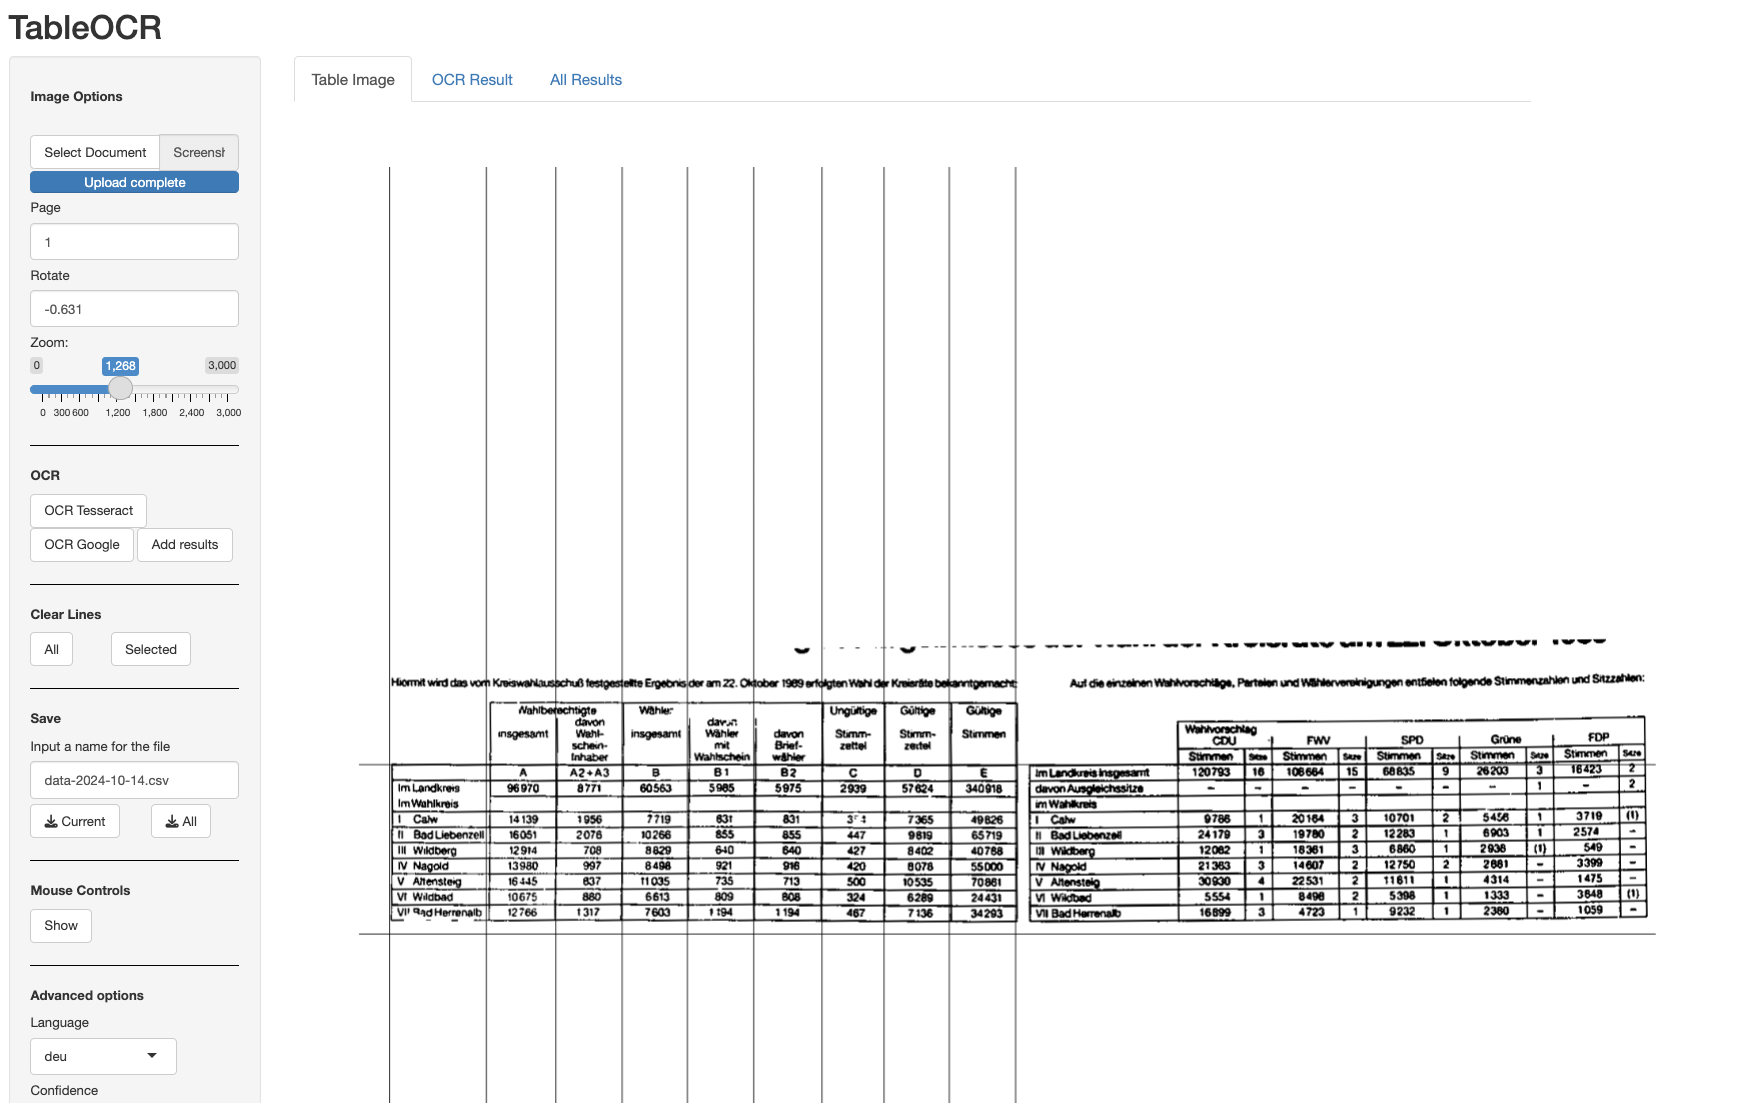
In a first step, we can load the image by clicking on the Select Document button and selecting the respective file. If images are tilted, we can rotate them by indicating the degrees below in the Rotate field. Number can be positive or negative. We can then set manually columns (or vertical lines by simple left mouse click) and top and bottom rule (left mouse click + a) to this table in order to extract it.
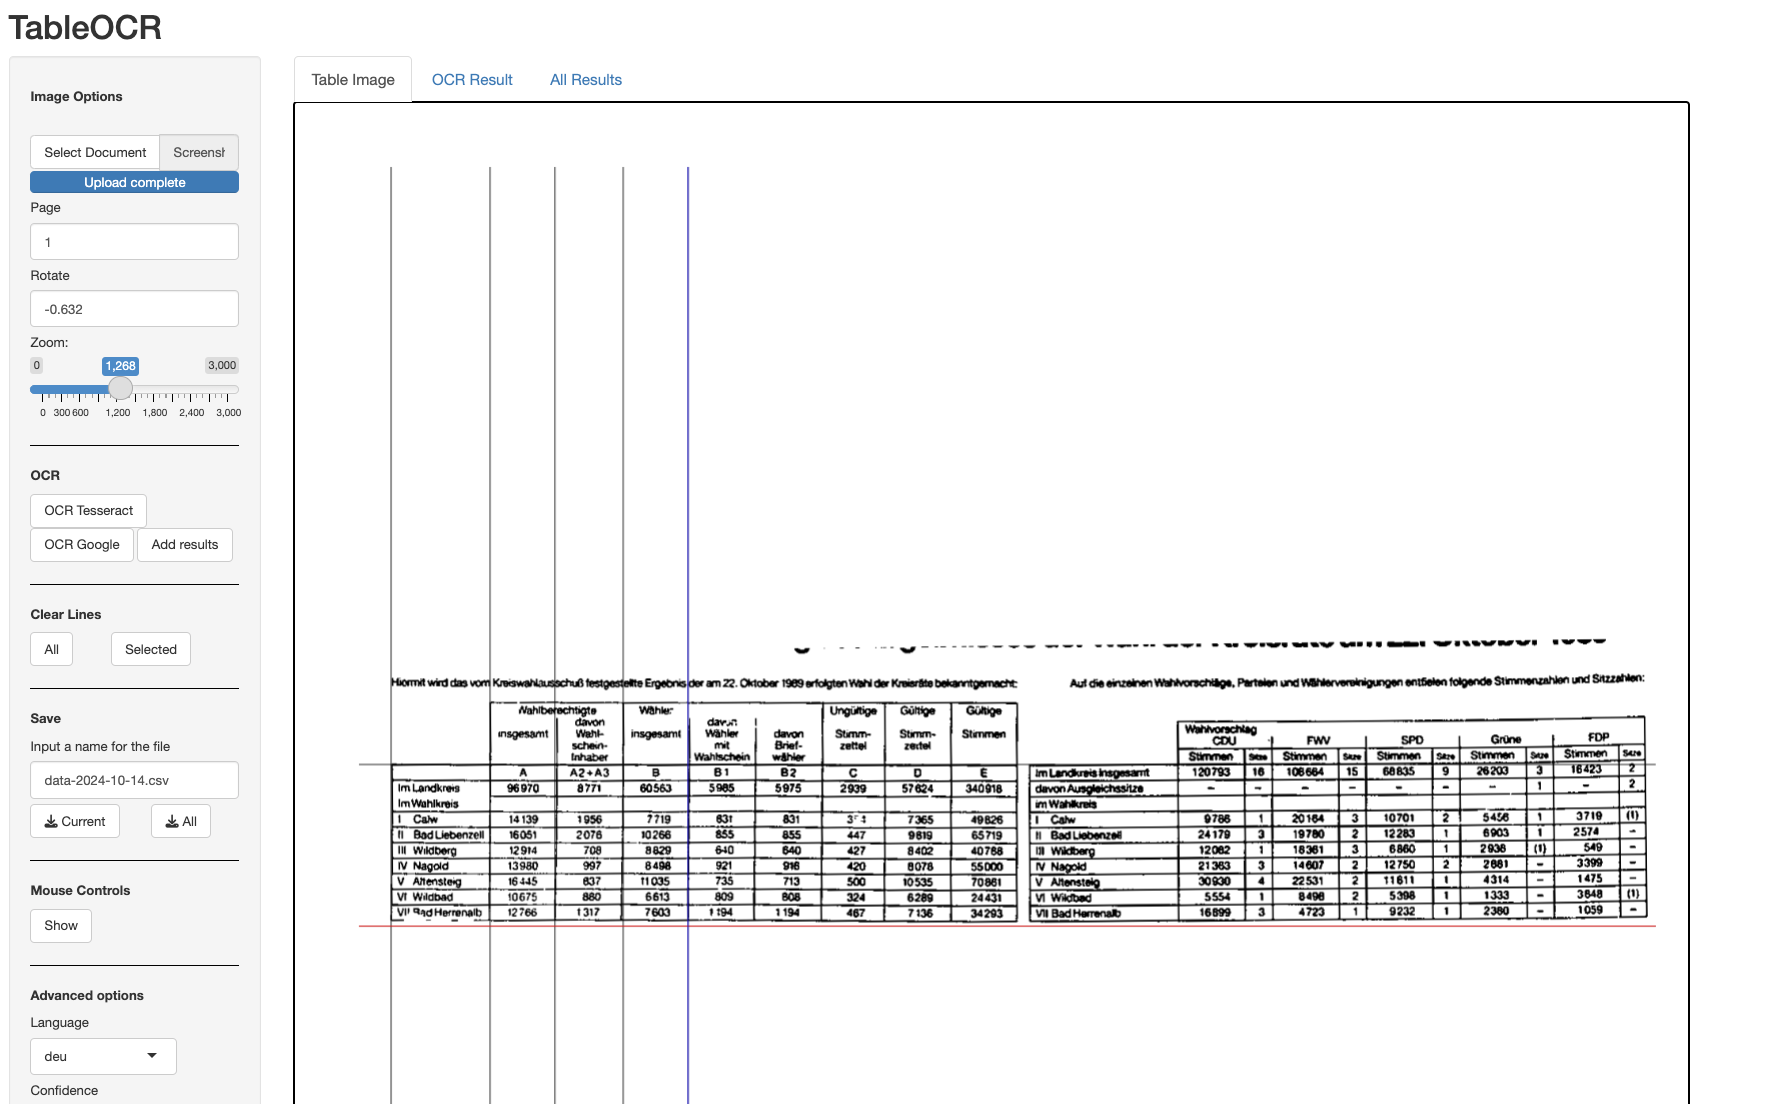
If we want to delete one of the lines that we set, we can do so by clicking near the respective line while holding d (left mouse click + d). Selected vertical lines become blue and horizontal lines red (see image below). If you want to delete the selected lines, press the Backspace key on your keyboard and the lines will disappear.
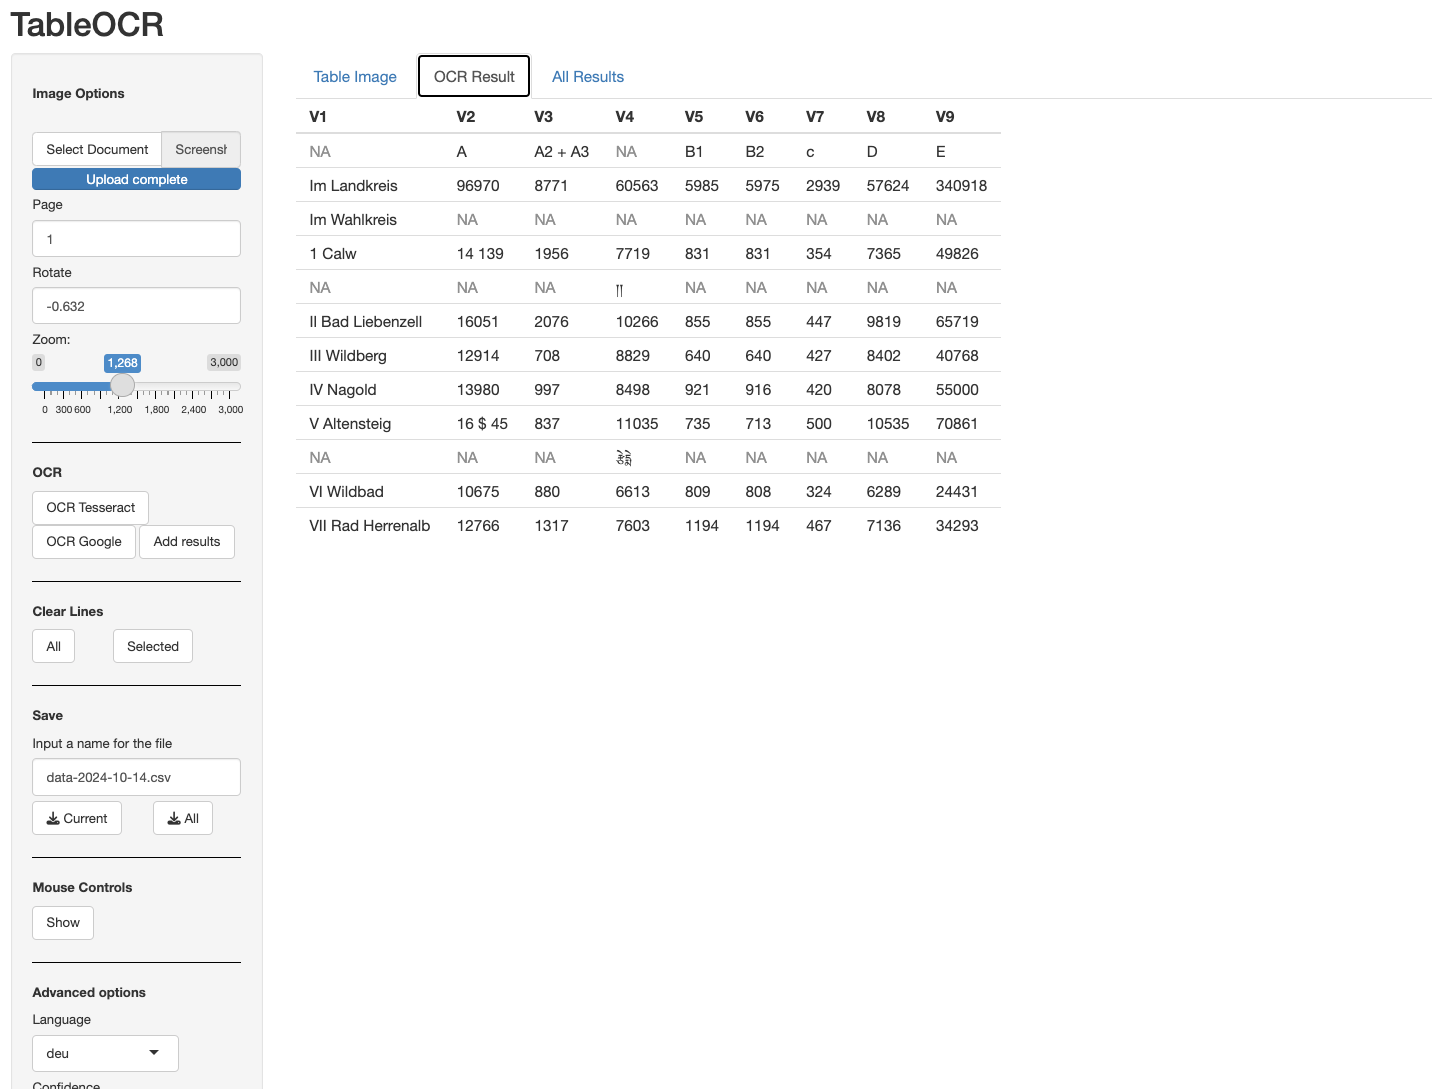
If you have set all lines, you can hit the OCR Google button. This will connect to the Google OCR. To check the quality of the recognized fields, you can turn visualization on.
You can then also look at the results by changing to the OCR Results tab. The results for our tables show that there is overall relative good recognition with two mistakes. A “4” was misread for a “$” and there is on additional row featuring a non-sensical result.